US home prices rebound as 80% of metros log Q2 price gains
US home prices rose in 80% of metro areas in the second quarter as tight supply offset weaker demand and high mortgage rates.
Lauren Collins ·
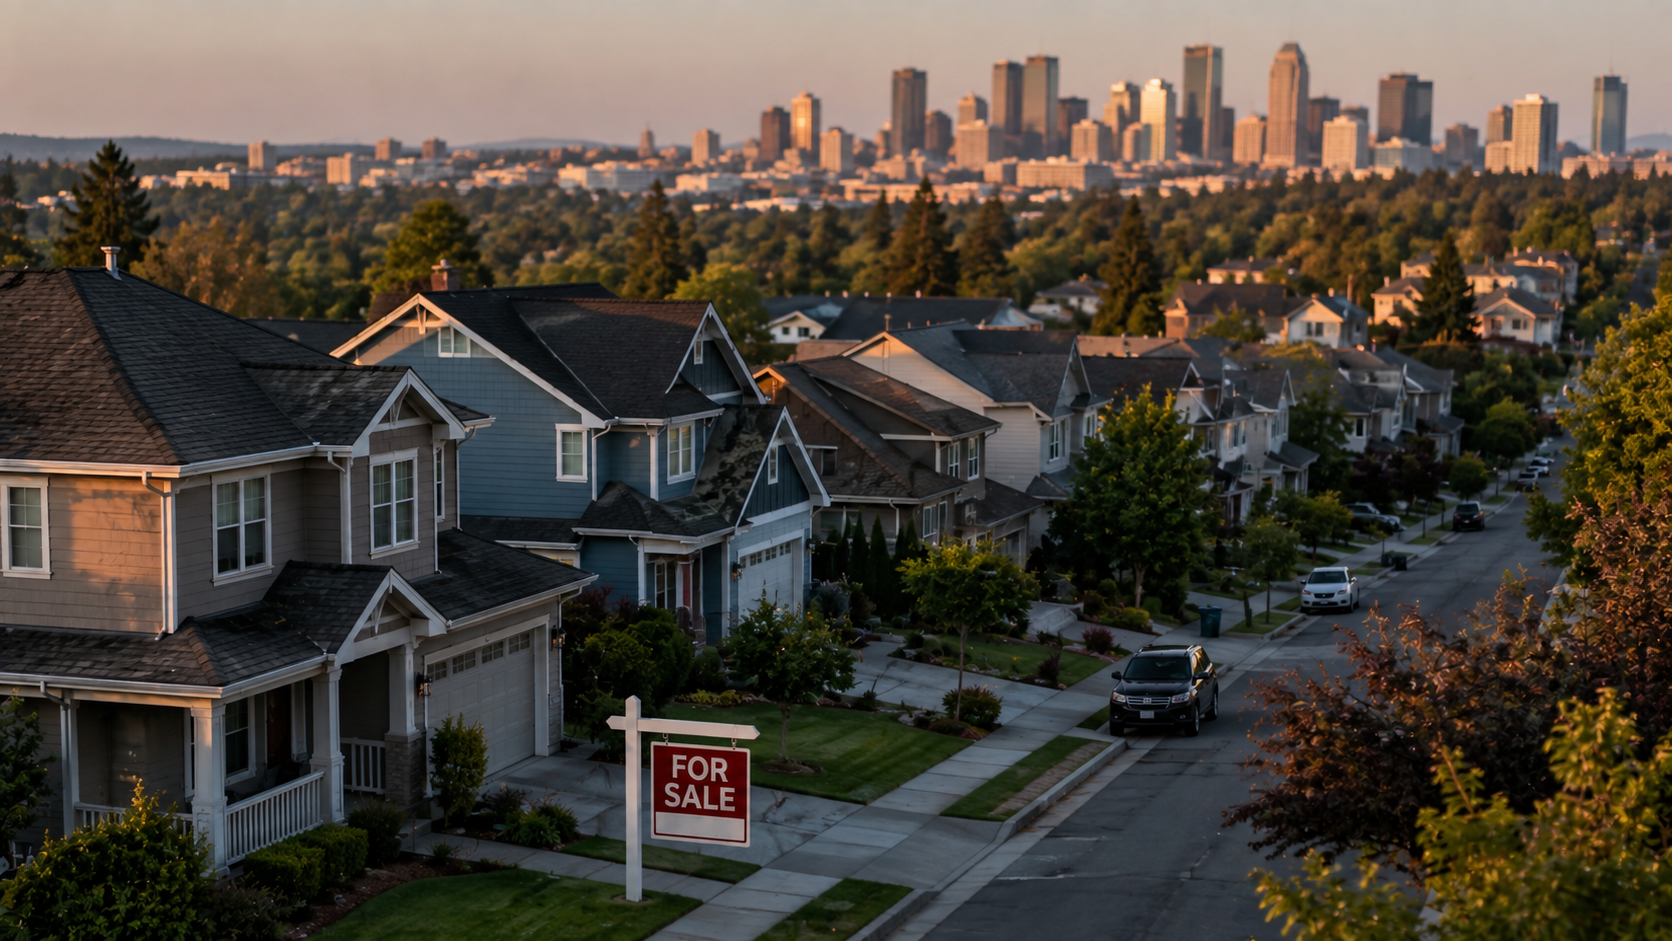
US home prices rose in 80% of metro areas in the second quarter, signaling that existing-home values regained traction after a weak spring.
Figures the National Association of Realtors published Tuesday showed a broader recovery than in the first quarter, when 71% of metropolitan areas posted annual gains. Nationally, the median price for previously owned homes rose 1.5% from a year earlier, compared with 0.5% in the first quarter.
Northeast supply lifts prices
The regional split was sharp. The Northeast recorded the strongest increase, with the median for an existing single-family home up 3.8% over the year to $547,200, a result NAR linked to tighter available supply than in some other parts of the country.
The Midwest followed with a 3.6% rise. The South, where inventories expanded more noticeably, posted a 1% gain, while the West slipped 0.8%, according to the association’s data.
Those numbers show who gained and who lost in the second quarter. Owners in markets with fewer listings regained some leverage, while buyers in those areas saw less relief from the affordability squeeze created by elevated borrowing costs.
Texas and Florida outliers
Some large markets moved far faster than the national average. Beaumont-Port Arthur, Texas, posted an 11% annual increase, and Naples-Immokalee-Marco Island, Florida, rose 10.5%, placing both at the top among large areas tracked by NAR.
The expensive end of the market remained heavily concentrated in California. San Jose-Sunnyvale-Santa Clara had a median price of $2.05 million even after a 4.2% decline, while San Francisco-Oakland-Hayward rose 5.2% to $1.5 million.
The contrast matters because the same national rate environment is producing different local outcomes. In lower-supply markets, sellers can resist discounting; in higher-inventory markets, buyers have more room to negotiate, although the South’s 1% rise shows that extra listings have not produced a broad price reset.
Pandemic surge still shadows market
The second-quarter pickup remains far below the pandemic-era boom. NAR’s data showed the latest gains are modest compared with the periods when annual price increases ran above 10% during 2021 and for stretches of 2020 and 2022.
That history frames the current market as a cooling cycle rather than a collapse. High mortgage rates have weakened demand by raising monthly payments, but limited supply in many areas has kept prices from falling more broadly.
The macro effect is uneven. Higher home values can support household wealth, but elevated payments restrict mobility, weigh on transaction activity and keep first-time buyers at a disadvantage against owners with existing equity.
If supply stays tight in the Northeast and parts of the Midwest, prices could remain firm even with softer demand. That would support household balance sheets, keep the existing-home market difficult for entry-level buyers and preserve pricing power for brokers and sellers in inventory-constrained metros.
If inventory keeps building in the South and West, price growth could cool further or turn negative in more markets. The mechanism is straightforward: more listings weaken seller leverage, which can reduce the wealth boost from housing while giving buyers more choices and pressuring lenders, agents and home sellers tied to transaction volumes.
The next test is whether mortgage rates, listings and regional job markets move in the same direction. The open risk is that affordability remains poor even if price gains moderate, leaving the housing market split between owners protected by scarcity and buyers still priced out by financing costs.