Utility-scale solar tops US grid additions in 2026
Utility-scale solar and battery storage led U.S. grid additions in H1 2026, with 207 solar projects and 95 storage installs, data shows.
Atlas Newsdesk ·
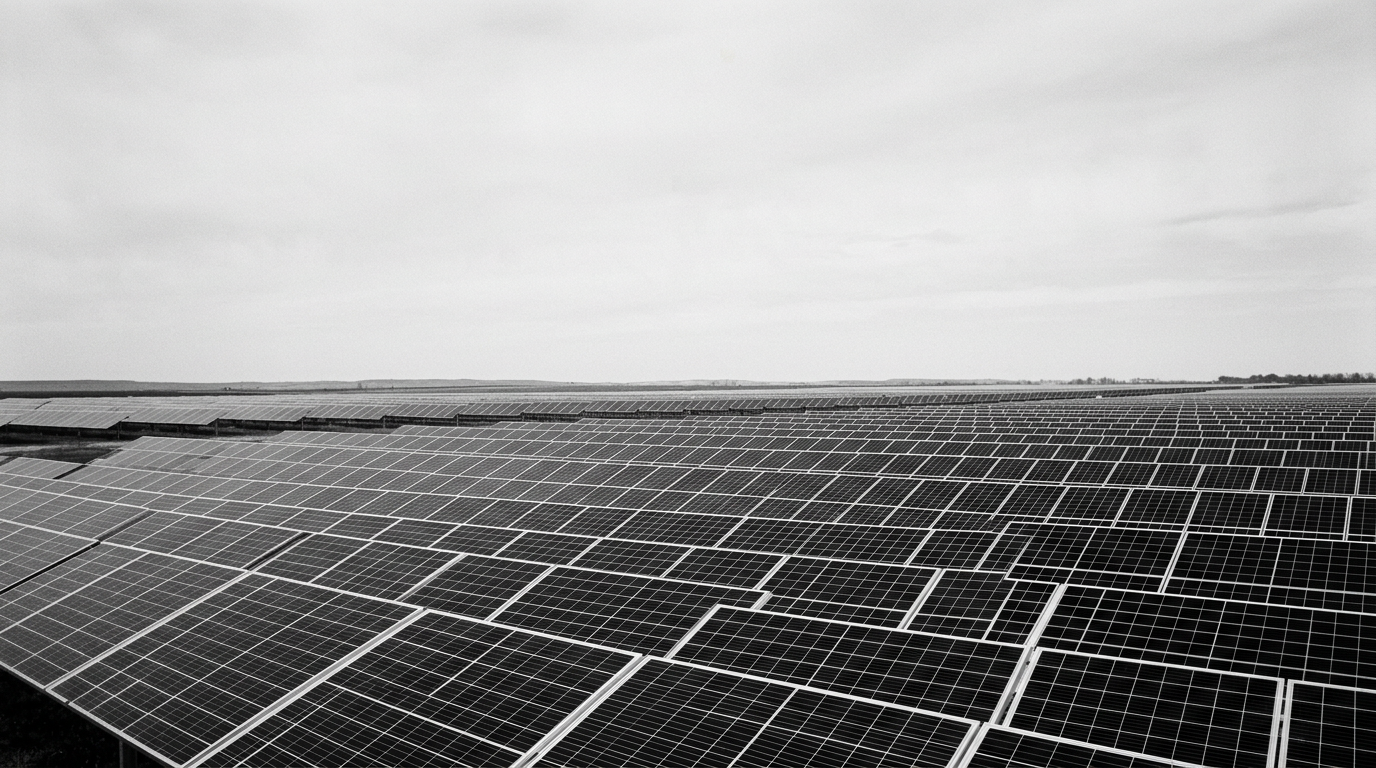
Utility-scale solar and battery storage made up the largest share of new U.S. power generation capacity entering service in the first half of 2026, according to data cited in the source material. The same dataset points to a clear concentration of development activity in these two technologies, with project totals well ahead of other types of builds.
During the period, 207 utility-scale solar projects began operating and 95 battery storage installations commenced operations, the source says. The combined number of solar-and-storage projects exceeded the project volume for fossil fuel and wind additions, even though some large wind facilities and natural gas plants still reached completion in the first half of the year.
Project totals highlight solar-and-storage momentum
The dataset described in the source indicates a widening gap in the number of projects connecting to the grid when compared with other technologies. As presented, that pattern supports the view that developers and utilities are placing most near-term emphasis on solar generation paired with storage.
The source attributes part of this momentum to the modular nature of these assets. It says solar and battery projects can be delivered in smaller increments and connected in stages, allowing additions to arrive progressively rather than depending on a small number of very large facilities reaching completion on a single schedule.
By contrast, the source characterizes the large wind and natural gas projects that did come online in the first half of 2026 as “long-term legacy developments.” In that framing, completions reflect earlier investment choices and multi-year development timelines more than they signal the newest direction of project starts.
Texas, New Mexico, and Arizona concentrate additions
New Mexico
Geography was a major factor in where new additions clustered. Texas, New Mexico, and Arizona were identified as the leading regions for new capacity, and together accounted for about 50% of national additions in the first half of 2026, according to the source. Texas stood out for both its additions and what did not appear in the completion list. The source says the state skewed toward battery storage and natural gas combustion, citing grid reliability needs as the driver for those technology choices. At the same time, the data cited in the source recorded zero new onshore wind project completions in Texas during the first half of 2026. The source does not assign that outcome to a single cause, presenting it instead as part of the period’s combined technology-and-geography mix. State policy differences and what remains uncertain The source describes meaningful variation across states, with local policy frameworks and incentives shaping what gets built and connected. Illinois led the country in the number of solar projects, even as the source says its individual facilities were smaller on average than those in states leading on capacity additions.
Across states, the overall picture described in the source is a move toward pairing utility-scale solar with battery storage as a preferred configuration. The source frames the advantages as practical, including siting flexibility and shorter development timelines than traditional thermal plants or large wind infrastructure.
The source also flags limits in what can be concluded from the first-half snapshot. It remains unclear from the provided information whether the technology mix shifts in the second half of 2026 as longer-lead projects reach completion, and the dataset referenced focuses on project counts and leading states rather than capacity totals by technology.
Separately, the source notes a macro backdrop of 2.1% USA 2026 real GDP growth from the IMF, up from a previous 2.0%. However, it does not quantify how that economic growth relates to the specific build pattern reflected in the first-half project totals.